Monitoring only
IDR 8.000.000 /month
- All system monitoring
- Company + owners + logo
- Engine parameters you select
- Portal + engineer view
- No modem bundle

Xdata Plant Monitoring using XCSM technology AI for automation to manage all data from engines and an automatic system to keep the machines operating well. Oil pumps, generators, factory engines and plant systems send live readings (pressure, voltage, stroke, load) to the portal and the engineer app. Know when the system is normal, over capacity, or failing.
IDR 8.000.000 /month
IDR 50.000.000 /month
IDR 100.000.000 /month
Extra modem = IDR 2.000.000 / month each (on 20- or 50-modem packages). Yearly = monthly × 12.
Requested systems stream operating data into Xdata. Engineers open one dashboard (or the mobile app) and check health in real time — just like XCSM puts documents and alerts in one place.
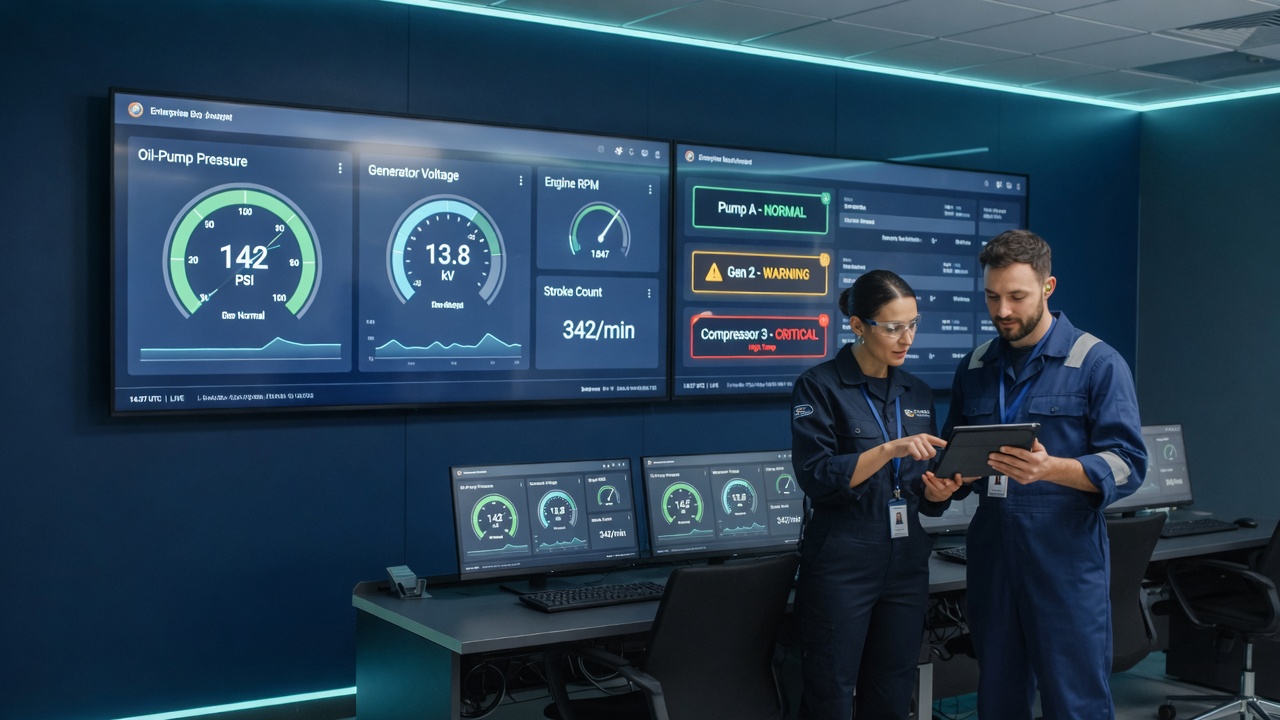
Every connected asset appears as a live card: name, site, last reading, and status (normal / warning / critical). Engineers do not hunt through local HMI screens — they log in at client.xdata.id the same way they already use XCSM.
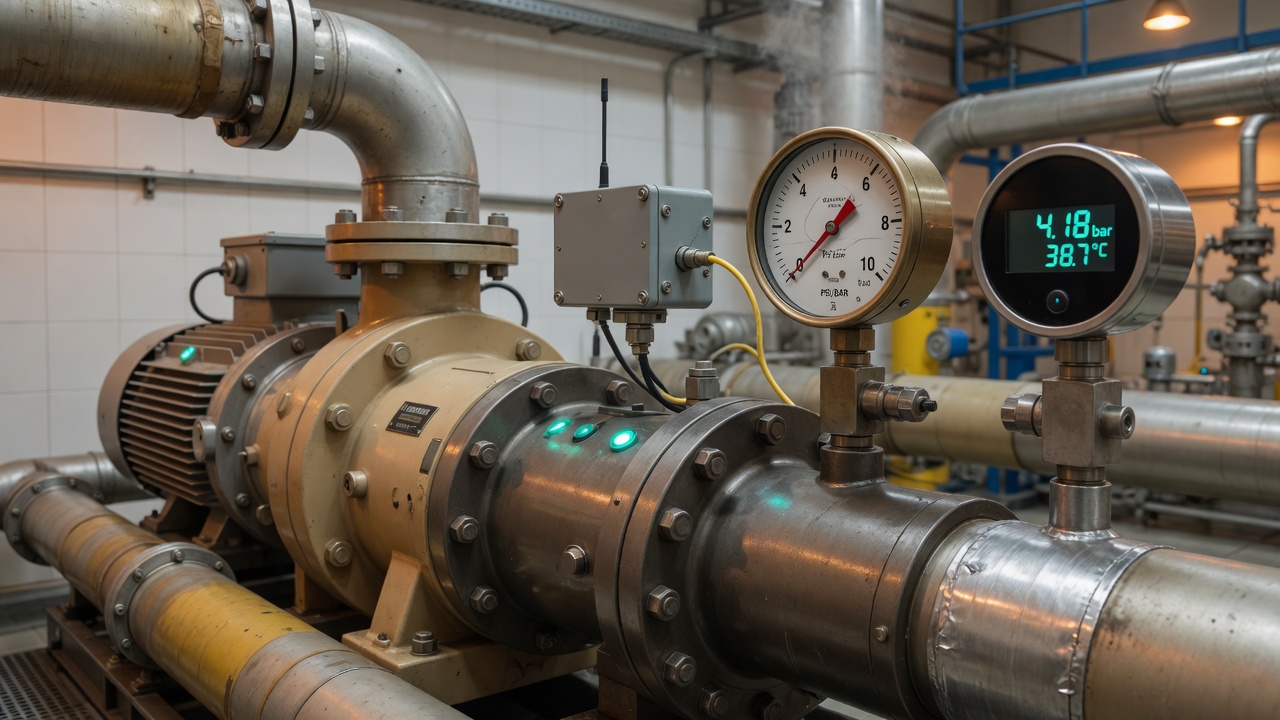
Pumps send pressure, flow, and temperature. Set a safe band: if pressure exceeds capacity or drops toward dry-run, the engineer is notified before the line stops.
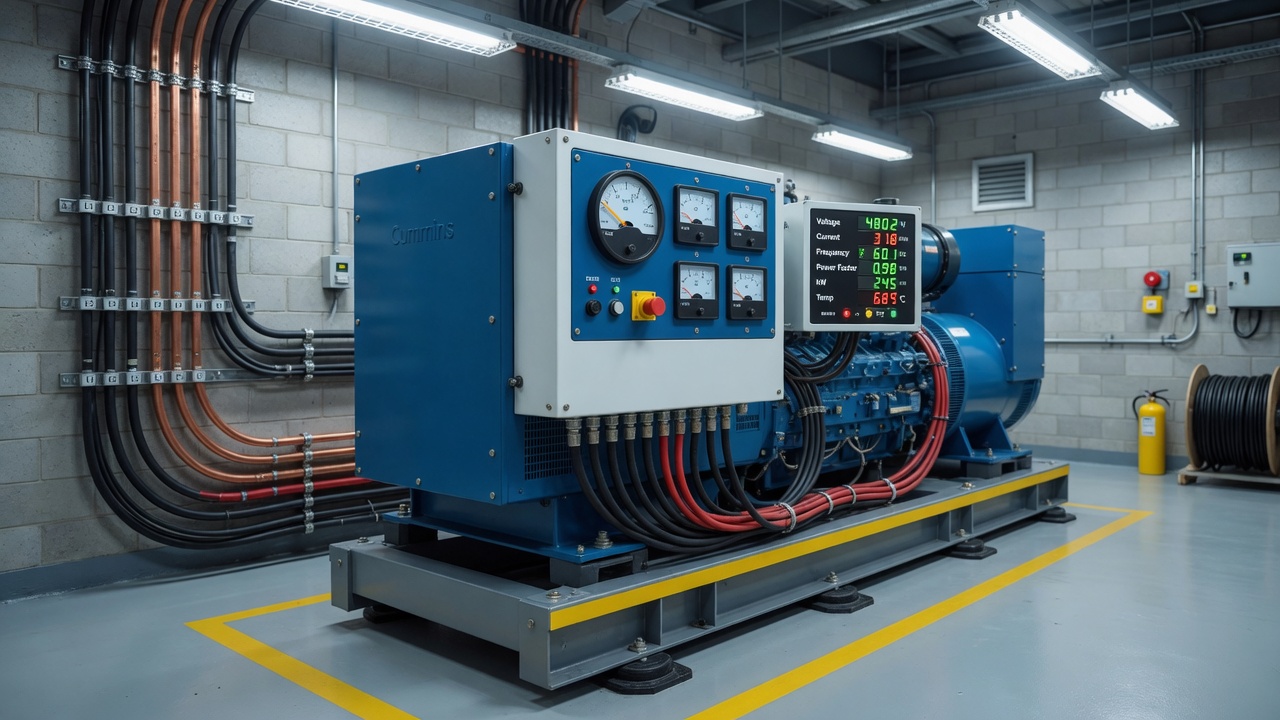
Generators report voltage, current, frequency, and load. See if the set is working normally, overloaded, or heading to a trip — from the office or the field.
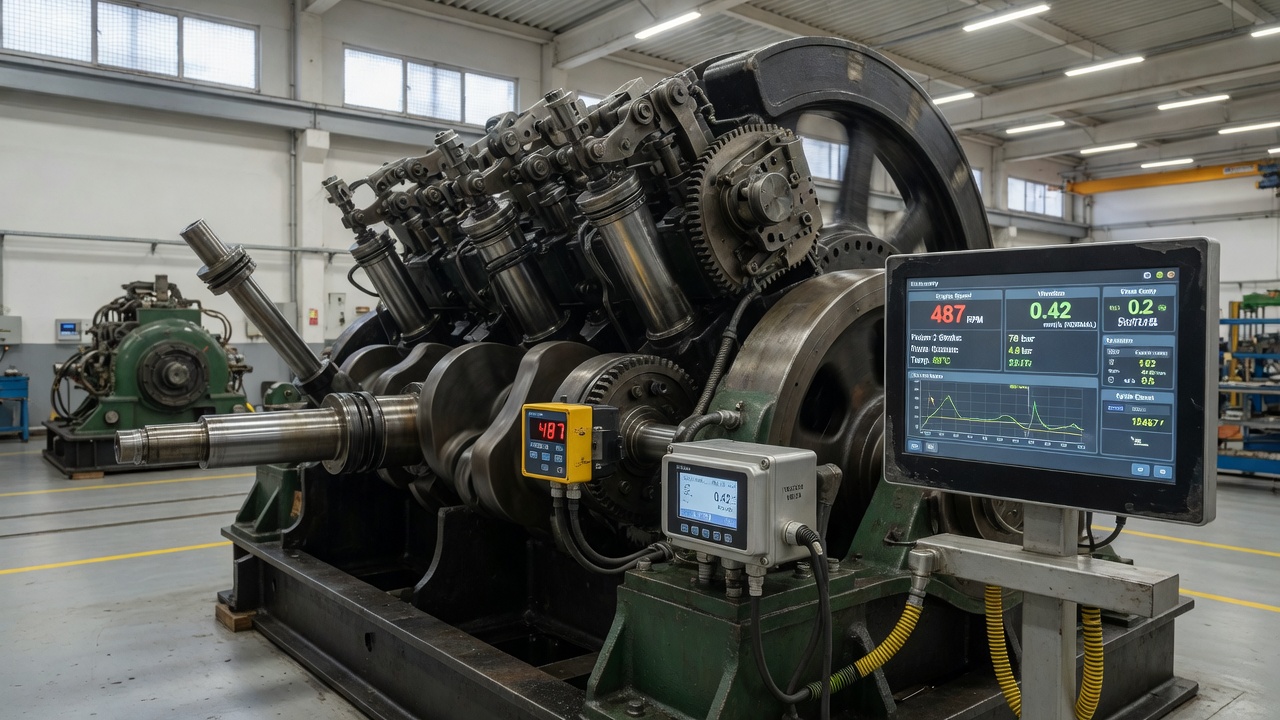
Reciprocating and plant engines send stroke, RPM, vibration, and oil pressure. Compare each cycle to the normal envelope so wear or a miss-stroke is visible before a hard failure.
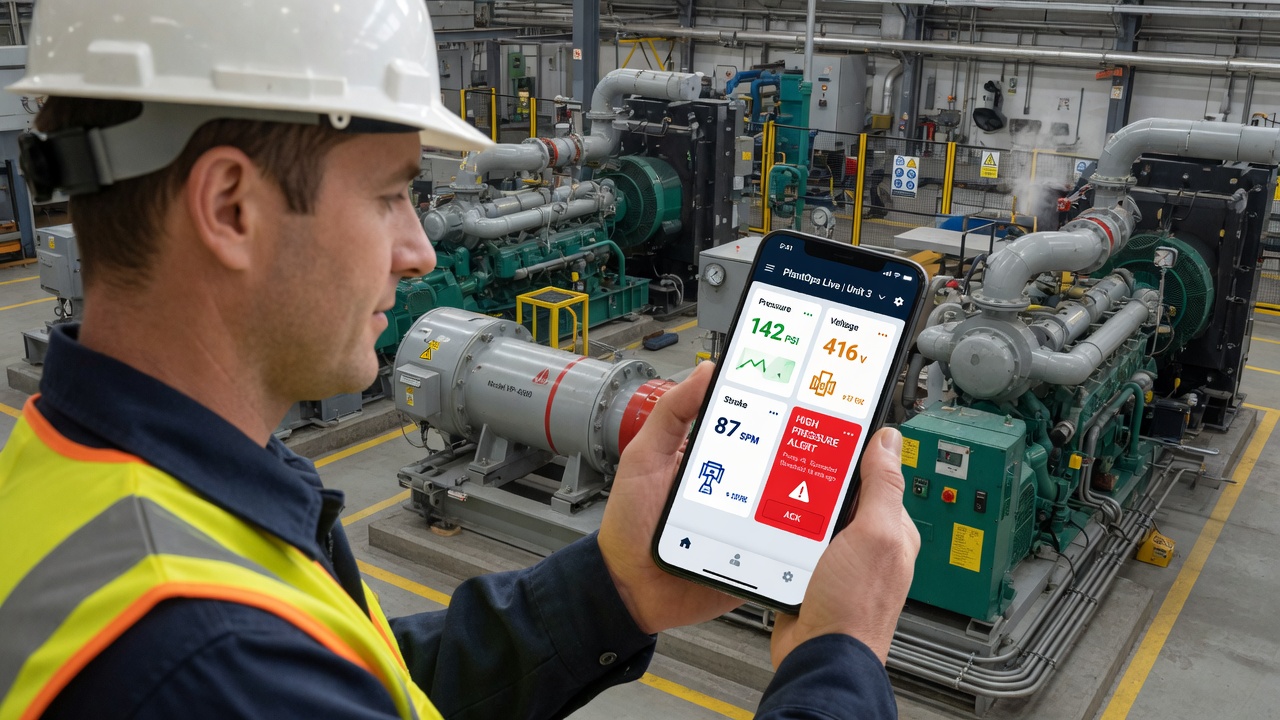
Data is sent to the Xdata app as well as the web portal. Duty engineers see the same status: working normally, exceeding capacity, or failure — and open the asset detail (last values, trend, site) without returning to the control room.
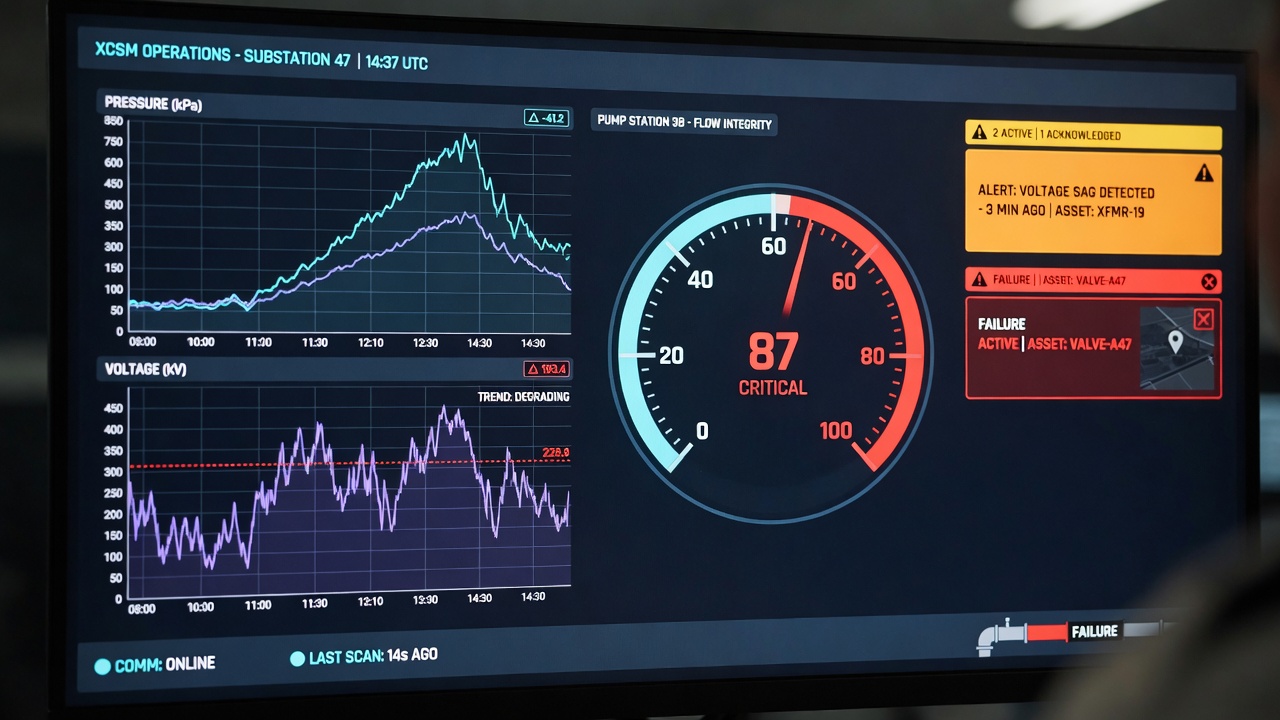
Rules are simple on purpose. Each signal has a normal band. Above the design limit = exceed capacity. Sensor loss, trip, or crash = failure. The portal stores the event so operations and management can review what the engine did.
Register on the client portal, choose Plant Monitoring, connect pumps, generators, and engines, and let engineers see live data in the same Xdata system they already use for XCSM.